This are notes I took while going through the Getting started with OpenTelemetry course given by the Linux Foundation. Primarily, it’s a way of solidifying concepts.
Observability
Important
how easily you can understand what’s happening inside a system, like an application or a service, by looking at the information it produces.
A distributed system is a network of independent computers, or nodes, working together to perform tasks as if they were a single system. These systems are widely used in applications like cloud computing, where different parts of an application run on different servers to share resources and balance the workload. Because of the complexity of distributed systems, it can be challenging to understand what’s happening inside each component at any given time. ==This is where observability becomes crucial.==
3 pillars
 3 pillars of observability
Logs
- append-only data structure that records events occurring in a system
- as systems became more complex, volume of logs became unmanageable → made them machine-readable → ingested into logging systems
Metrics
- High level overview of the current state of the system
- Counters, Gauges, Histograms, and Summaries
Traces
- understand the chain of events in a distributed system → HARD
- the basic idea is to add metadata to logs → be able to reconstruct the journey of requests through a distributed environment
- Eg: trace IDs or span IDs
Telemetry
Telemetry is the process of automatically collecting and transmitting data from remote or distributed systems to monitor, measure, and track the performance or status of those systems
Current problems in the approach to Observability
Telemetry silos disconnection
- A person using an observability solution, have to move back and forth between different types of telemetry to build up a mental model and reason about the behavior of a system.
- Since observability tools are silos of disconnected data, figuring out how pieces of information relate to one another causes a significant cognitive load for the operator.
Lack of instrumentation standard
- Difficult to correlate events from different systems
- Can’t integrate multiple solutions
Vendor Lock-in
- After committing to a solution, the application contains many solution-specific library calls throughout its codebase.
- To switch to another observability and re-instrumentation makes migration difficult, which is a form of vendor lock-in.
Goals of OpenTelemetry
- Unified telemetry: Combines tracing, logging, and metrics into a single framework enabling correlation of all data and establishing an open standard for telemetry data.
- Vendor-neutrality: Integration with different backends for processing the data.
- Cross-platform: Supports various languages (Java, Python, Go, etc.) and platforms.
What is not
- Not an All-in-One Monitoring or Observability Tool Doesn’t replace full-fledged monitoring or observability platforms like Datadog, New Relic, or Prometheus.
- Not a Data Storage or Dashboarding Solution OpenTelemetry doesn’t store or visualize data. (Grafana, Jaeger, or Prometheus)
- Not a Pre-configured Monitoring Tool It requires configuration and integration with other systems.
- Not a Performance Optimizer
While it helps you collect detailed performance data, it doesn’t automatically optimize application performance.
Otel Framework
Signal Specification (Language-Agnostic)
OpenTelemetry is structured around signals or categories of telemetry. (Metrics, logs, traces, and baggage)
The spec has 3 parts:
- Definition of terms or glossary
- Technical details of signals
- API spec: defines interfaces to be used by implementations
- SDK spec: requirements for language-specific implementations. Guide for devs
- Semantic conventions: define a common set of attributes to provide meaning to collected data, such as span names, metric instruments, units, etc ( see
http.request.method)
- Otel Protocol: defines how data is encoded in memory and a protocol to transport it across the network
Instrumentation (Language-Specific)
It consists 2 parts
API
- define interfaces and constants
- used by apps/libs developers
SDK
- implements the OTEL API
- contains the code to generate, process and emit telemetry
- Otel includes official sdks for many languages but you can write your own
We use the OTEL API to add instrumentation to our source code. This can be achieved in various ways:
- zero-code or automatic instrumentation (avoid code changes)
- instrumentation libraries that provide OTEL integration (may require code changes)
- manual or code-based instrumentation (fine-grained control)

The primary reason for separating the API from the SDK is that it makes it easier to embed native instrumentation into open source library code. OTEL API is designed to be lightweight and safe to depend on. The signal’s implementation provided by the SDK is significantly more complex and likely contains dependencies on other software.
Telemetry Processor

Besides providing the tooling to instrument apps and libraries, OTEL also provides an Operator, whose main tasks are:
- Receive data from different sources
- Process it (parsing, metadata enrichment, filtering, normalization, buffering)
- Deliver it to backends for storage/analysis.
Instrumentation
What is instrumentation
Instrumentation refers to the process of adding code or using tools to collect telemetry data (such as logs, metrics, and traces) from an application.
Types of instrumentation
| Type | Effort | Control | Customization | Code Changes | Example |
|---|---|---|---|---|---|
| Automatic Instrumentation | Low | Limited | Minimal | None | OTel agents for Python or Java |
| Instrumentation Libraries 🟡 | Medium (some configuration) | Moderate (framework-level) | Minimal to moderate | Django/Spring instrumentation libraries | |
| Manual Instrumentation | High 🟠 | Full | Full | Extensive | Define custom spans/attributes/events for a specific block of code |
Instrumentation libraries
- The long-term vision of OpenTelemetry is for third-party libraries or frameworks to ship with native OpenTelemetry instrumentation.
- Not all projects have native support for the evolving OpenTelemetry APIs.
- To address this gap, instrumentation libraries have been developed.
- Registry | OpenTelemetry
Auto instrumentation
opentelemetry-bootstrap Python
opentelemetry-bootstrap --help
-a {install,requirements}, --action {install,requirements}

install - uses pip to install the new requirements using to the currently active site-package.

requirements - prints out the new requirements to stdout. Action can be piped and appended to a requirements.txt file.
Annotation libraries
Allows you to add observability for custom telemetry
- how many times a specific function was executed
- how much time does it take to execute it
- what values receive as input
Manual Instrumentation
Reasons for using manual instrumentation:
- Lack of support for auto-instrumentation
- Fine-grained control over what and how telemetry gets generated
- Make o11y part of the development process
- Library author or maintainer who wants to offer native instrumentation to your users
 OTel’s Tracing Signal
Traces - Python
Types of SpanProcessors
- Synchronous
- Blocks the program execution to forward spans as soon as they are generated.
- Tracing instrumentation adds additional latency to requests
- Asynchronous
- Application starts and closes spans, but immediately resumes execution.
- Via a BatchSpanProcessor
- Maintains a buffer for completed spans
- A separate thread is launched that flushes batches of spans to exporters at regular intervals (or when a threshold is met)
- Has performance advantages, but spans might be dropped if the application crashes before spans are exported or when the buffer capacity is met
Anatomy of a span
A span in OpenTelemetry represents a single operation within a trace and carries information that provides insight into the operation’s execution.
{
    "name": "index", # Human readable
    "context": { # Unique for each span
        "trace_id": "0xf2c8876e5b85457ecb2c0090362c6a57",
        "span_id": "0x3153f56881ecee56",
        "trace_state": "[]"
    },
    "kind": "SpanKind.INTERNAL", # Role (Internal|Server|Client)
    "parent_id": null, # This is the root of a new trace
    "start_time": "2025-06-08T17:15:30.867810Z",
    "end_time": "2025-06-08T17:15:30.973194Z",
    "status": {
        "status_code": "UNSET"
    },
    "attributes": { # Span custom attributes
        "http.method": "GET",
        "url.path": "/",
        "http.response.status_code": 200
    },
    "events": [],
    "links": [],
    "resource": { # Environment info
        "attributes": {
            "telemetry.sdk.language": "python",
            "telemetry.sdk.name": "opentelemetry",
            "telemetry.sdk.version": "1.26.0",
			"service.name": "my-app.py", # Custom resource attributes
            "service.version": "0.1"
        },
        "schema_url": ""
    }
}- Set of static attributes that help us identify the source (and location) that captured a piece of telemetry.
- Examples:
service.nameservice.versioncloud.providerpod.name
- Semantic Conventions play an important role for maintaining consistency
Context Propagation
- Distributed tracing is about understanding the chain of operations that make up a transaction.
- To construct a trace, we need to tie individual spans together.
NOTE
Propagation is the mechanism that moves context between services and processes. It serializes or deserializes the context object and provides the relevant information to be propagated from one service to another.
Propagation is usually handled by instrumentation libraries and is transparent to the user. In the event that you need to manually propagate context, you can use the Propagators API.

B3 Propagation format - https://github.com/openzipkin/b3-propagation
00-aaaaaaaaaaaaaaaaaaaaaaaaaaaaaaaa-00ffffffffffffff-01
<spec version>-<trace_id>-<parent_id>-<trace flag>.
Metrics
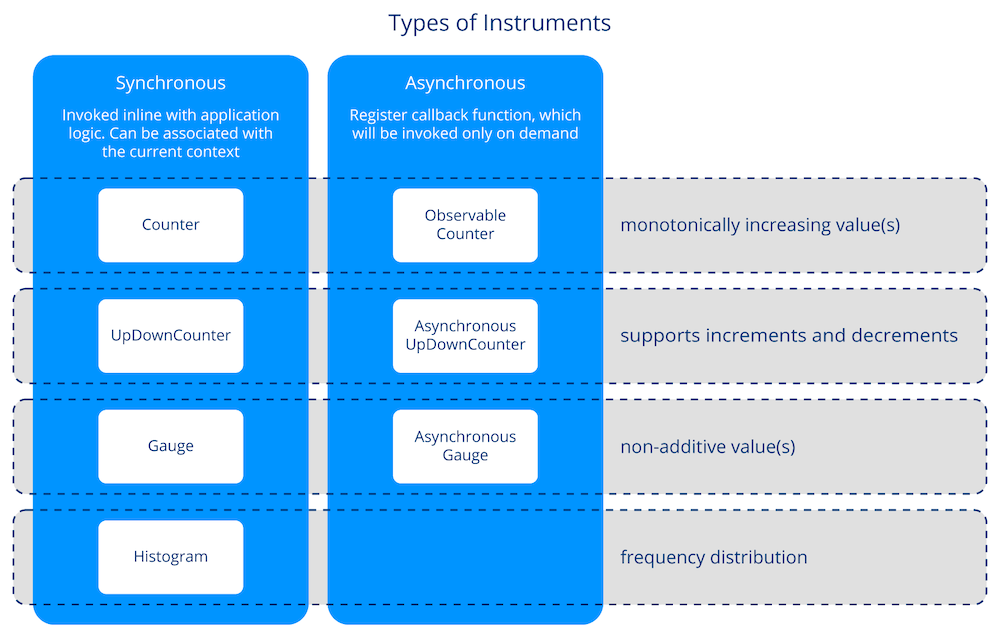
We do not use meters directly to generate metrics.
- Meters produce a set of instruments.
- An instrument reports measurements, which represent a data point reflecting the state of a metric at a particular point in time.
- Instruments are the objects that you use to record metrics and represent specific metric types, such as counters, gauges, or histograms.
- Each instrument has a unique name and is associated with a specific meter.
Example: Number of req to a web server
- Use a meter to create an instrument (Counter)
- Each time a request comes in, the counter records a measurement (a single data point)
- Over time, these data points are aggregated, which provide a summary (total number of requests)
Types of Instruments
Anatomy of a metric
{
    "resource_metrics": [
        {
            "resource": {
                "attributes": {
                    "telemetry.sdk.language": "python",
                    "telemetry.sdk.name": "opentelemetry",
                    "telemetry.sdk.version": "1.26.0",
                    "service.name": "unknown_service"
                },
                "schema_url": ""
            },
            "scope_metrics": [
                {
                    "scope": {
                        "name": "app.py",
                        "version": "0.1.0",
                        "schema_url": "",
                        "attributes": null
                    },
                    "metrics": [
                        {
                            "name": "index_counter",
                            "description": "Total amount of requests to /",
                            "unit": "request",
                            "data": {
                                "data_points": [
                                    {
                                        "attributes": {
                                            "path": "/",
                                            "http.request.method": "POST"
                                        },
                                        "start_time_unix_nano": 1749541577394810908,
                                        "time_unix_nano": 1749541642450630006,
                                        "value": 1
                                    },
                                    {
                                        "attributes": {
                                            "path": "/",
                                            "http.request.method": "GET"
                                        },
                                        "start_time_unix_nano": 1749541577394810908,
                                        "time_unix_nano": 1749541642450630006,
                                        "value": 1
                                    }
                                ],
                                "aggregation_temporality": 2,
                                "is_monotonic": true
                            }
                        }
                    ],
                    "schema_url": ""
                }
            ],
            "schema_url": ""
        }
    ]
}
We can conclude that the instrument reports separate counters for each unique combination of attributes. This can be incredibly useful. For example, if we pass the status code of a request as an attribute, we can track distinct counters for successes and errors.
The number of attributes and the range of values can quickly lead to many unique combinations. High cardinality means we have to keep track of numerous distinct time series, which leads to increased storage requirements, network traffic, and processing overhead.
4 golden signals of o11y
- Traffic: volume of requests handled by the system
- Errors: rate of failed requests
- Latency: the amount of time it takes to serve a request
- Saturation: how much of a resource is being consumed at a given time
Google SRE monitoring ditributed system - sre golden signals
Latency
- Measure everything is costly → Sampling
- Histograms are ideal because they show frequency distribution (P50, 95, 99)
Saturation
- Brendan Gregg defines saturation as the “amount of work that a resource is unable to service.”
- In other words, saturation is a backlog of unprocessed work.
- An example of a saturation metric would be the length of a queue.
Logs
With the increased complexity of computer programs, especially with the introduction of distributed systems, just printing any data to a file or stdout was no longer sufficient.
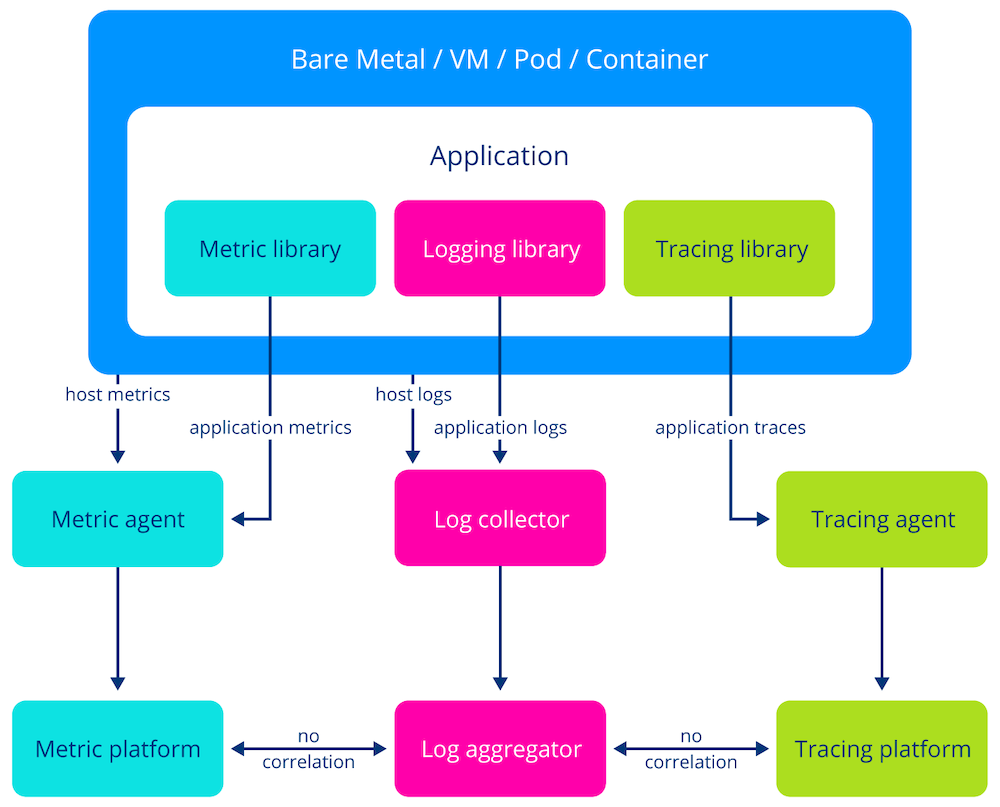 Telemetry Collection Before OpenTelemetry
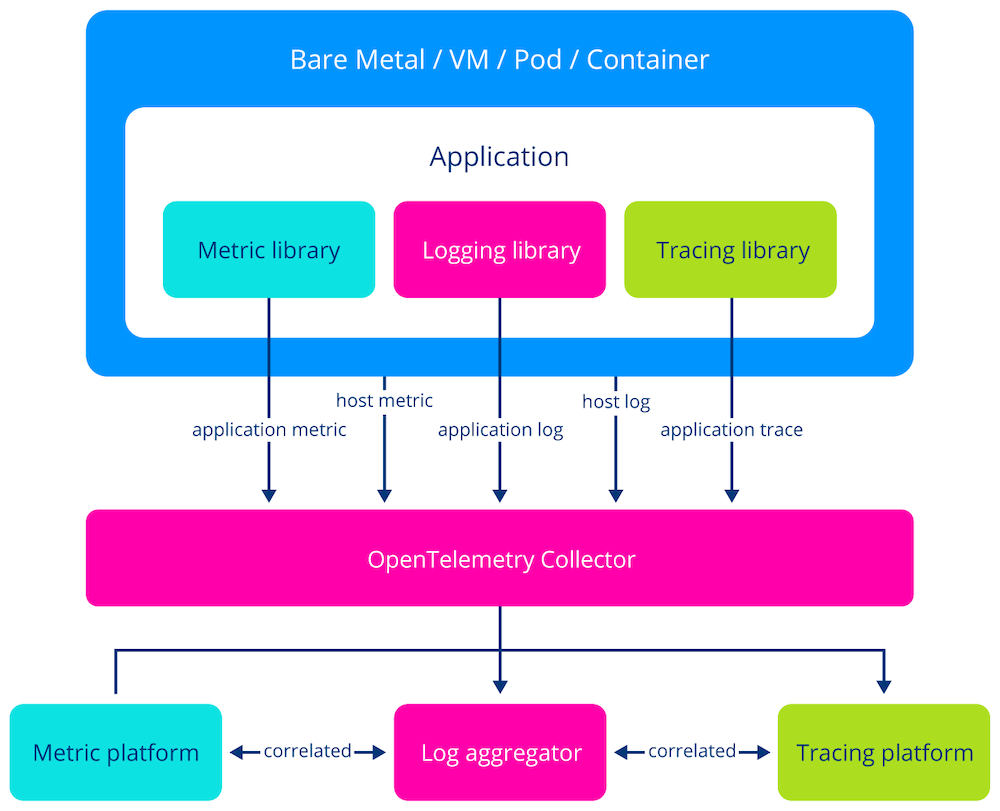 With OTEL Collector
Data model
- Logging in OpenTelemetry differs a little from the other signals.
- It’s designed so that existing data models can be mapped to the OpenTelemetry data model.
- system formats generated by the operating system (e.g., syslog),
- logs from third-party applications (e.g., Apache log files)
- logs from first-party apps where developers can customize the logging format.
Process
- The log entry, which is of type
LogRecord, consists of multiple fields like timestamp, traceId, spanId, severityText, body - Log entries are sent into a
LogRecordExporter. - We use a
LoggerProviderfactory to create newLoggerinstances that are initialized once and match the application’s lifecycle. - When logs are created,
LogRecordExportersare responsible for sending the log entries to the OpenTelemetry Collector.
Anatomy of a LogRecord
# Normal Log
2025-06-11 10:06:34,181 - root - 6074 - INFO - Info from the index function

# OTLP LogRecord
{
    "body": "Info from the index function",
    "severity_number": "<SeverityNumber.INFO: 9>",
    "severity_text": "INFO",
    "attributes": {
        "code.filepath": "/workspaces/LFS148-code/exercises/manual-instrumentation-logs/initial/src/app.py",
        "code.function": "index",
        "code.lineno": 45
    },
    "dropped_attributes": 0,
    "timestamp": "2025-06-11T10:06:34.181544Z",
    "observed_timestamp": "2025-06-11T10:06:34.181694Z",
    "trace_id": "0x00000000000000000000000000000000", # This could be correlated if tracing is enabled
    "span_id": "0x0000000000000000",
    "trace_flags": 0,
    "resource": {
        "attributes": {
            "telemetry.sdk.language": "python",
            "telemetry.sdk.name": "opentelemetry",
            "telemetry.sdk.version": "1.26.0",
            "service.name": "python-app"
        },
        "schema_url": ""
    }
}
Otel Collector
The OpenTelemetry Collector is a critical infrastructure component that decouples telemetry generation from its processing and export, allowing for flexible configuration outside the application code. Centralizing telemetry management, streamlines monitoring and observability across diverse systems, improving scalability, maintainability, and operational efficiency. We will discuss the usage of the OpenTelemetry Collector, the architecture of telemetry pipelines, and different ways to deploy a collector.
SDK: the telemetry pipeline was defined in the application code. Collector: a binary written in Go, that runs as a separate, standalone process. It provides a flexible, configurable, and vendor-agnostic system to process telemetry outside the application.
- Good for adjusting the configuration and keeping it consistent across applications.
- No need to redeploy after a change to the telemetry pipeline
- Reduce overhead for apps
Architecture
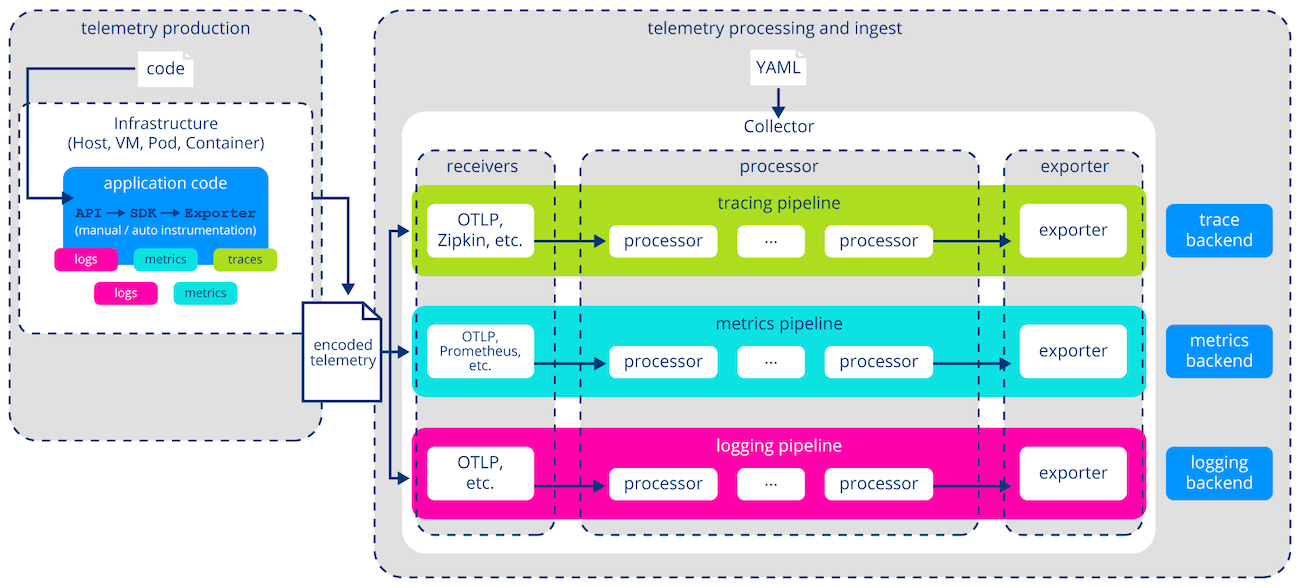
Receivers
- A receiver is how data gets from a source to the collector
- Pull or push-based
- Supports OTLPReceiver which is the native OTLP format
- opentelemetry-collector-contrib/receiver at main · open-telemetry/opentelemetry-collector-contrib · GitHub includes examples of receivers for plenty of external formats
Processors
- A processor provides a mechanism to pre-process telemetry before sending it to a backend.
- 2 categories: some apply to all signals, while others are specific to a particular type of telemetry.
- The order in which they are defined is important, since data is passed from one processor to the next.
- Reasons to use them:
- To improve the data quality
- Governance and compliance
- Reduce cost (drop unwanted telemetry)
- Security (sensitive information)
Exporters
- The exporter takes the data, converts the internal representation into a protocol of choice, and forwards it to one (or more) destination.
- Same as receivers, it has built-in support for OTLP.
- collector-contrib includes exporters for many telemetry protocols.
Deployment
| Sidecar | Node Agent | Standalone Service | |
|---|---|---|---|
| Description | the collector runs as a container next to the application | Collector is the collection point for all apps on a node | Deploy the collector as another service in our cluster |
| Good 🟢 | fast communication (local) | - Central point to manage telemetry. - It can collect system-level telemetry | - Horizontally scalable - Doesnt compete with apps for resources |
| Disadvantages 🟡 | loads each pod with telemetry processing | loads the node with telemetry processing | loads the cluster (???) |
Configuration
- Configure OTLP exporters in code to send telemetry to the collector
- Configure the collector
Sample config
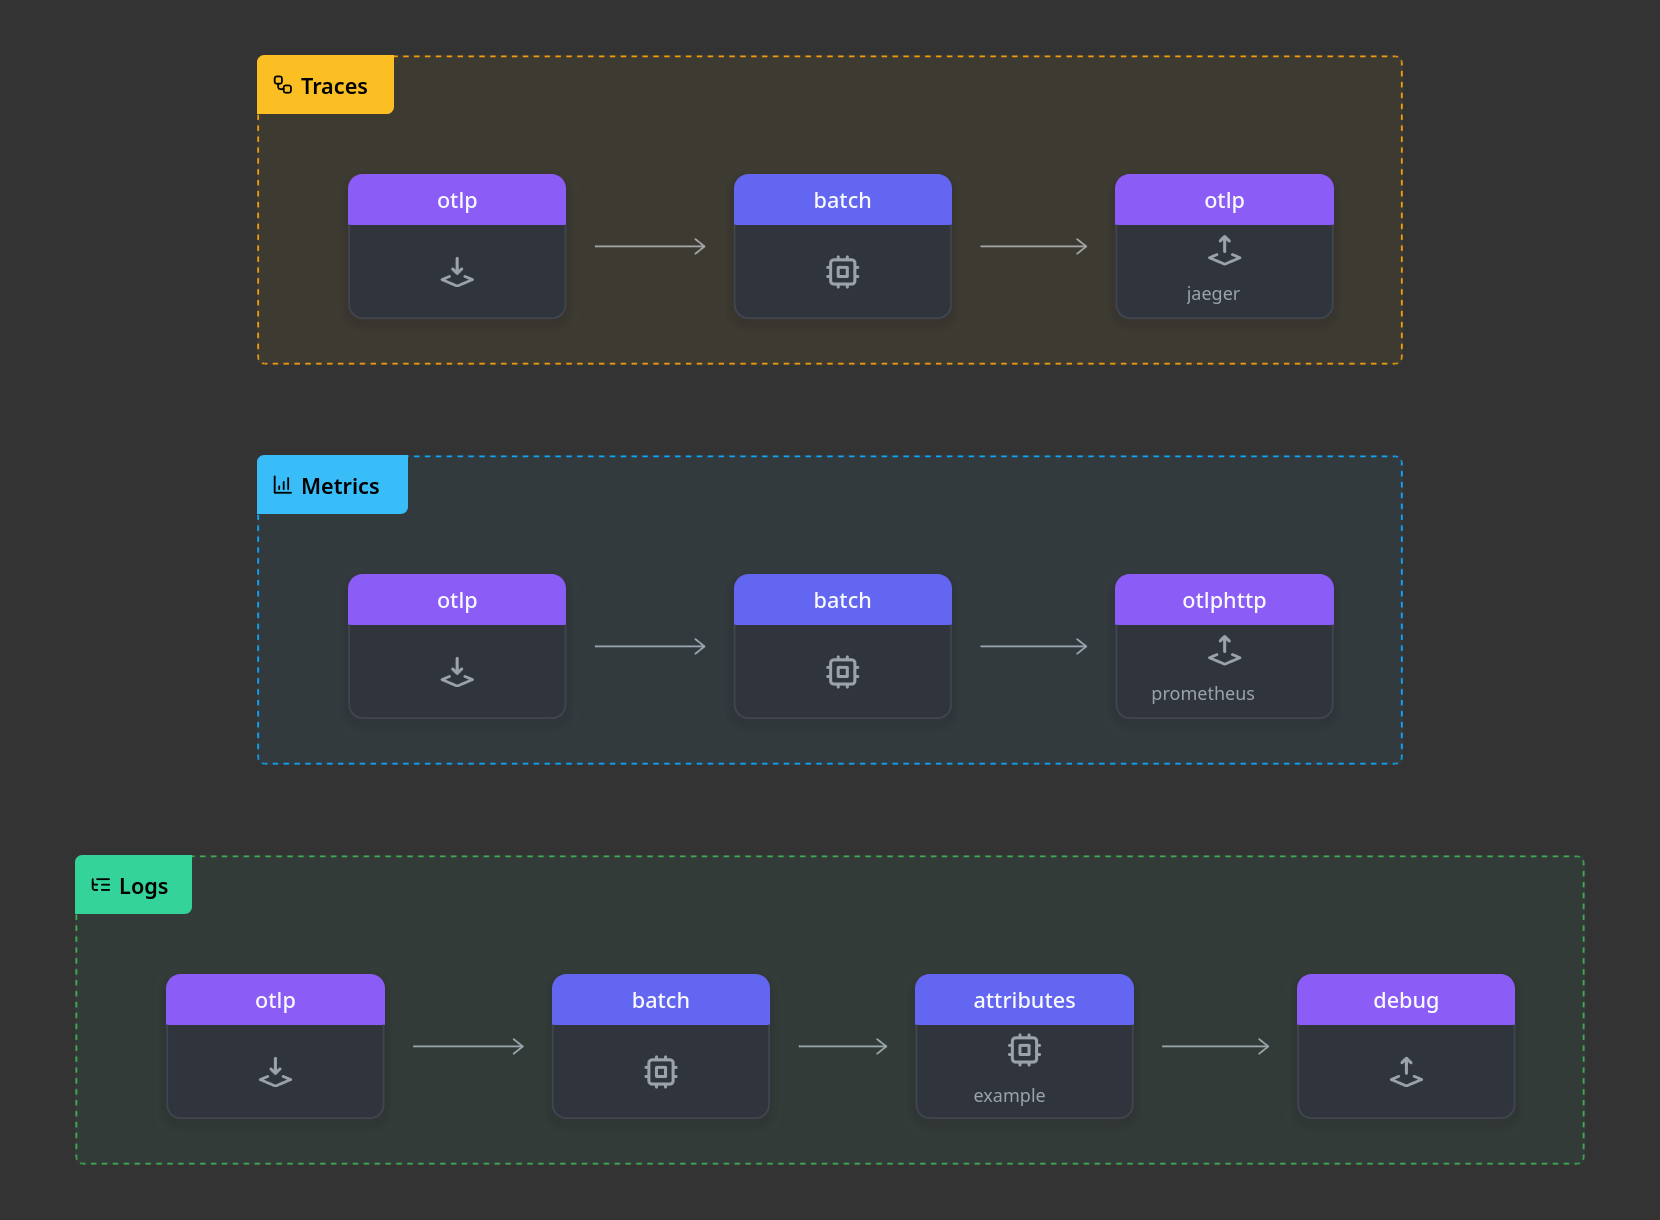
# Tell the collector where to listen for logs, metrics and traces
# Other custom receivers https://github.com/open-telemetry/opentelemetry-collector-contrib/tree/main/receiver
receivers:
  otlp:
    protocols:
      grpc:
        endpoint: 0.0.0.0:4317
      http:
        endpoint: 0.0.0.0:4318

# How to process the received data
# This is where you transform, filter, update, create and delete data
# Custom processors - https://github.com/open-telemetry/opentelemetry-collector-contrib/tree/main/processor
processors:
  batch: # Batch processing is recommended for buffering and sending telemetry data in batches.
  attributes/example:
    actions:
      - key: example_field
        action: insert
        value: Hello from the OTEL Collector

# How and where to forward telemetry
exporters:
  otlphttp/prometheus:
    endpoint: "http://prometheus:9090/api/v1/otlp"
    tls:
      insecure: true # Simplicity - Use certificates in production

  otlp/jaeger:
    endpoint: "jaeger:4317"
    tls:
      insecure: true

  debug:
    verbosity: detailed

# list of desired extensions to be enabled
# Extensions examples - https://github.com/open-telemetry/opentelemetry-collector/blob/main/extension/README.md
extensions:

 # configure the data flow for pipelines
service:
  # A valid pipeline requires at least one receiver and exporter
  # receive the data via otlp
  # process the data with batch
  # send the data to the debug exporter.
  pipelines:
    traces:
        receivers: [otlp]
        processors: [batch]
        exporters: [debug]
    metrics:
        receivers: [otlp]
        processors: [batch]
        exporters: [debug]
    logs:
        receivers: [otlp]
        processors: [batch, attributes/example] # use example processor
        exporters: [debug]